
Main listing
Expert stock screeners
Visit FAQsTrendlyne's most popular multi-query and expert stock screeners. These fundamental and technical stock screeners are also sorted by various categories - highest returns, DVM, live results, volume and more. You can edit these stock screeners, set screener alerts, and create your own
| Screener Name | Description | Parameters | #Stocks | Set Alerts |
|---|---|---|---|---|
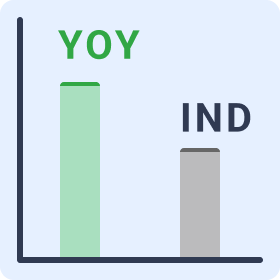 Quarter Revenue and Net Profit Growth YoY higher than Industry Revenue and Net Profit Growth screener★Screener of the week | Stocks whose quarterly revenue and net profit YoY growth are higher than the industryRevenue Growth Qtr YoY % > Industry Revenue Growth Qtr YoY % and Net Profit Qtr Growth YoY % > Industry Net Profit Growth Qtr YoY % and Latest financial result = Previous Quarter Date | Revenue Growth Qtr YoY %Industry Revenue Growth Qtr YoY %Net Profit Qtr Growth YoY %Industry Net Profit Growth Qtr YoY %Latest financial resultPrevious Quarter Date | - |  |
 High DVM Mid and Small Caps (subscription) screener | Stocks in the mid and small cap segment with high durability (good financial strength) and technical momentum. To follow this screener, set an alert.Trendlyne Durability Score > 65 and Trendlyne Momentum Score > 59 and Market Capitalization < 10000 and Market Capitalization > 60 | Trendlyne Durability ScoreTrendlyne Momentum ScoreMarket Capitalization | - | |
 High Momentum - Stocks with Highest Trendlyne Momentum Score screener | This screener looks for high Technical Momentum Score stocks. As seen in the screener, stocks with high Momentum Scores significantly outperform indices. The screener is optimized to pick the top 20 stocks with the highest Momentum scores. This screener is a dynamic screener that changes stocks based on daily momentum, and momentum changes. Stocks enter and exit this screener on an ongoing basis. To follow this screener, set a screener alert. For this screener, we recommend a weekly alert. This is a shorter-term screener due to its focus on technicals.Trendlyne Momentum Score > 70 | Trendlyne Momentum Score | - | |
 High Piotroski Score - Companies with strong financials screener | Screener tracking stocks with a High Piotroski Score (the well-known piotroski score checks the company's financial strength). To get notified of changes to the screener, set an alert.Piotroski Score > 7 | Piotroski Score | - | |
 All Stars: High Scorers Across Metrics screener | Stocks that score high across key metrics: DVM, Piotroski Score, Buy-Sell Zone, Checklist scores and SWOTTrendlyne Durability Score >= 60 and ( Is Stock In PE Buy Zone or Is Stock in PE Neutral Zone ) and Piotroski Score > 6 and Revenue Qtr 2Yr QoQ Growth % > 0 and SWOT Strengths > 5 and Trendlyne Momentum Score >= 60 and 5Yr price change % > 10 and TL Checklist Positive Score > 10 | Trendlyne Durability ScoreIs Stock In PE Buy ZoneIs Stock in PE Neutral ZonePiotroski ScoreRevenue Qtr 2Yr QoQ Growth %SWOT StrengthsTrendlyne Momentum Score5Yr price change %TL Checklist Positive Score | - | |
 High Trendlyne Checklist Score Stocks screener | Stocks with high positive checklist score and low negative checklistTL Checklist Positive Score > 10 and TL Checklist Negative Score < 6 | TL Checklist Positive ScoreTL Checklist Negative Score | - | |
 Stocks in PE Buy Zone with Reasonable Durability Score, and Rising Momentum Score screener | Stocks in Buy Zone (according to historical PE) with reasonable Durability and Rising Momentum ScoresIs Stock In PE Buy Zone and Trendlyne Durability Score >= 55 and Trendlyne Momentum Score > Prev Month Trendlyne Momentum Score and Trendlyne Momentum Score >= 55 | Is Stock In PE Buy ZoneTrendlyne Durability ScoreTrendlyne Momentum ScorePrev Month Trendlyne Momentum Score | - | |
Low PE stocks with PE TTM lower than 3 year, 5 year and 10 year average PE screener | Stocks with low PE and trailing twelve month (TTM) PE lower than 3 year, 5 year and 10 year average PEPE TTM Price to Earnings < 40 and PE TTM Price to Earnings > 0 and PE TTM Price to Earnings < PE 3Yr Average and PE TTM Price to Earnings < PE 5Yr Average and PE TTM Price to Earnings < PE 10Yr Average | PE TTM Price to EarningsPE 3Yr AveragePE 5Yr AveragePE 10Yr Average | - | |
 Upcoming Bonus/Split screener | Stocks with upcoming bonuses and splitsLatest bonus split date > Today | Latest bonus split dateToday | - | |
 Consistently Performing Growth Stocks screener | Companies with a track record of consistent revenue growth and poised for further expansion in the near futureBasic EPS Qtr > 1.3 * Basic EPS 4Qtr Ago and Revenue Growth Annual YoY % > 15 and Basic EPS Annual 1Yr Ago > ( Net Profit Annual 2Yr ago / Number Of Shares Qtr End ) and Net Profit 3Yr Growth % > 15 and Discount to 52Week High % > - 20 and Market Capitalization > 10 and ROE Annual % > 10 | Basic EPS QtrBasic EPS 4Qtr AgoRevenue Growth Annual YoY %Basic EPS Annual 1Yr AgoNet Profit Annual 2Yr agoNumber Of Shares Qtr EndNet Profit 3Yr Growth %Discount to 52Week High %Market CapitalizationROE Annual % | - | |
Stocks with improving cash flow, with good durability screener | Stocks whose operating cash flow (long term) is improving, and that are showing good durability score in their financials. As seen in the backtest result, this screener significantly outperforms indices. This screener is a dynamic screener that changes stocks based on changing cash flows, and the durability score.Operating Cash Flow 3Yr Growth % > Operating Cash Flow 5Yr Growth % and Operating Cash Flow 3Yr Growth % > 0 and Trendlyne Durability Score > 45 and Net Cash Flow Annual > 0 and Net Cash Flow YoY Growth % > 10 | Operating Cash Flow 3Yr Growth %Operating Cash Flow 5Yr Growth %Trendlyne Durability ScoreNet Cash Flow AnnualNet Cash Flow YoY Growth % | - | |
 Forecaster Special - Strong sequential growth screener | Companies which are set to witness high QoQ revenue and net income growth in next quarterForecaster estimates 1Q Forward EPS QoQ Growth % > 15 AND Forecaster estimates 1Q Forward Revenue QoQ Growth % > 15 AND Forecaster Estimates 1Q forward Net Income Quarter > 100 | Forecaster estimates 1Q Forward EPS QoQ Growth %Forecaster estimates 1Q Forward Revenue QoQ Growth %Forecaster Estimates 1Q forward Net Income Quarter | - | |
 Stocks with high upside potential by Forecaster with high revenue and EPS growth outlook screener | Profitable companies with high upside potential by Forecaster driven by strong revenue and EPS growth outlook. This screener filters for stocks with a consensus rating of 'Strong Buy' or 'Buy'.Forecaster Estimates 12Mth Upside % > 0 and Forecaster Estimates 1Y forward EPS Growth Annual % > 15 and Forecaster Estimates 1Y forward Annual Revenue Growth % > 15 and Forecaster Estimates 1Q forward Qtr Revenue YoY Growth % > 15 and Forecaster Estimates year goneby Net Income Annual > 100 and Net Profit Annual > 100 and Revenue Growth Annual YoY % > 20 and ( Forecaster Estimates Broker Consensus is Buy = 1 or Forecaster Estimates Broker Consensus is Strong Buy = 1 ) | Forecaster Estimates 12Mth Upside %Forecaster Estimates 1Y forward EPS Growth Annual %Forecaster Estimates 1Y forward Annual Revenue Growth %Forecaster Estimates 1Q forward Qtr Revenue YoY Growth %Forecaster Estimates year goneby Net Income AnnualNet Profit AnnualRevenue Growth Annual YoY %Forecaster Estimates Broker Consensus is BuyForecaster Estimates Broker Consensus is Strong Buy | - | |
 Promoters increasing shareholding QoQ screener | Stocks where promoters are increasing shareholding on QoQ basisPromoter holding change QoQ % > 0.1 | Promoter holding change QoQ % | - | |
 Golden Cross 50 day over 200 day screener | This screener uses Day SMA50 and Day SMA200 parameters.Day SMA50 > Day SMA200 | Day SMA50Day SMA200 | - | |
 Forecaster Consensus Recommendation is Strong Buy, and Higher than Consensus View on Industry screener | This screener shows stocks with a 'Strong Buy' Forecaster consensus recommendation, which is higher than the industry consensusForecaster Estimates Broker Consensus is Strong Buy and Forecaster Estimates industry reco > 1 | Forecaster Estimates Broker Consensus is Strong BuyForecaster Estimates industry reco | - | |
 Companies with 10% increase in share price over three months, with rising net profit growth screener | Stocks that have beaten Sensex performance, rising sharply over the past three months.Net Profit QoQ Growth % > 0 and Net Profit Qtr Growth YoY % > 0 and Qtr Change % > 10 | Net Profit QoQ Growth %Net Profit Qtr Growth YoY %Qtr Change % | - | |
 Consistent high performing stocks over Five Years screener | Stocks which saw the highest performance in past year as well as longer periods( 1Yr change % > 50 or 2Yr price change % > 50 ) and 3Yr price change % > 30 and 5Yr price change % > 30 | 1Yr change %2Yr price change %3Yr price change %5Yr price change % | - | |
 Relative Outperformance versus Sector over the Quarter (3 Months) screener | This screener shows stocks with their Qtr Change % trading above their Sector Qtr Change %Qtr Change % > Sector Qtr Change % | Qtr Change %Sector Qtr Change % | - | |
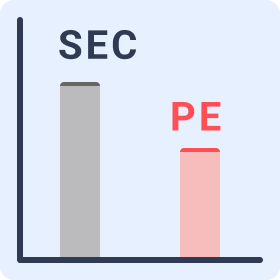 PE less than sector PE screener | Stocks whose Price to Earnings (PE) is less than their sector PEPE TTM Price to Earnings < Sector PE TTM and PE TTM Price to Earnings > 0 | PE TTM Price to EarningsSector PE TTM | - | |
Momentum Score (Technical Score) Daily Gainers screener | Trendlyne Momentum Score gainers over previous day. The momentum score is calculated on basis of technical indicators like SMA, RSI, MFI, MACD, ROC, ATR, ADX and other technical values.Trendlyne Momentum Score / Prev Day Trendlyne Momentum Score > 1.1 AND Trendlyne Momentum Score > 40 | Trendlyne Momentum ScorePrev Day Trendlyne Momentum Score | - | |
 High Momentum - Stocks with Highest Trendlyne Momentum Score screener | This screener looks for high Technical Momentum Score stocks. As seen in the screener, stocks with high Momentum Scores significantly outperform indices. The screener is optimized to pick the top 20 stocks with the highest Momentum scores. This screener is a dynamic strategy that changes stocks based on daily momentum, and momentum changes. Stocks enter and exit this screener on an ongoing basis. To follow this screener, set a screener alert. For this screener, we recommend a weekly alert. This is a shorter-term strategy due to its focus on technicals.Trendlyne Momentum Score > 70 | Trendlyne Momentum Score | - | |